Reverse engineering the brain.
Our mission is to understand the brain by reverse engineering it. The best way to understand something is to take it apart and put it back together again. In our case we will take apart a biological brain and put it back together digitally. We are starting with a mouse because it is small enough to be feasible and useful enough that what we learn can unlock trillions of dollars of value.
- Mapping one mouse brain today
- $7.5 to 21.7B
- Electron microscopes and human proofreaders. Wellcome, 2023.
- Our target
- under $100M
- About 100x less.
- How
- Light microscopes, sixteen-fold expansion, and models trained on human proofreaders' corrections.
- With the receptors labeled, so the map says what each drug target does.
The brain is the organ we understand least. Mapping it neuron by neuron is the way to understand it. Mapping it costs billions.
The one cubic millimeter of mouse brain that has been mapped, finished in 2025, came out of a five-year, $100 million program, and its proofreading by hand is still going on. A whole mouse brain is about 500 of those (Badea et al., 2007, the volume Wellcome's report uses), and Wellcome's 2023 estimate for mapping one this way is $7.5 to 21.7 billion, almost all of it the wages of the people correcting the computer's tracing. MICrONS and Wellcome.
Because no such map exists, drugs for the brain are developed without one. Most brain drugs act on a protein on neurons, a receptor, a transporter or an ion channel, but nobody knows, neuron by neuron, where the neurons that carry it send their signals, so what a drug will do in the brain is still learned by giving it to animals and then to people.
The GLP-1 drugs, which earned about $70 billion in 2025, act on one receptor, or two in the newest of them, and nobody knows, synapse by synapse, which circuits produce each of their effects: less appetite, nausea, less heavy drinking, better sleep apnea. Nausea limits the dose, and the two latest papers on the neurons responsible disagree about where the weight loss comes from, and neither group could see, synapse by synapse, which neurons those populations connect to. So the industry is choosing the next generation of these drugs by testing receptor combinations in trials of a year or more on thousands of people.
2025 revenue from Lilly and Novo Nordisk. The two papers: Nature in 2024 and JCI in 2026.
Light instead of electrons. AI instead of manual proofreading.
Historically electron microscopes were used because mapping the brain's wiring takes a resolution of about 20 nanometers, the gap between two neurons at a synapse, which is about ten times finer than a light microscope can resolve. By expanding the tissue sixteen-fold we can now image using light microscopes, which are about a tenth the price of the electron microscopes used so far (E11 Bio's estimate) and show proteins, a receptor among them, in the same image rather than in a second, correlated imaging step. Once a microscope holds LICONN's resolution over a whole brain, imaging it is a capital problem, not a research one: about 400 microscope-years at LICONN's spinning-disk rate by our arithmetic, far fewer on a light sheet, and that light sheet is the first instrument we build. We put it back together with software: one model traces the neurons and their connections, and a second model, trained on the millions of corrections human proofreaders have made to the public maps, finds and fixes the first one's mistakes. That is the step people still do by hand, and the one that costs the most.
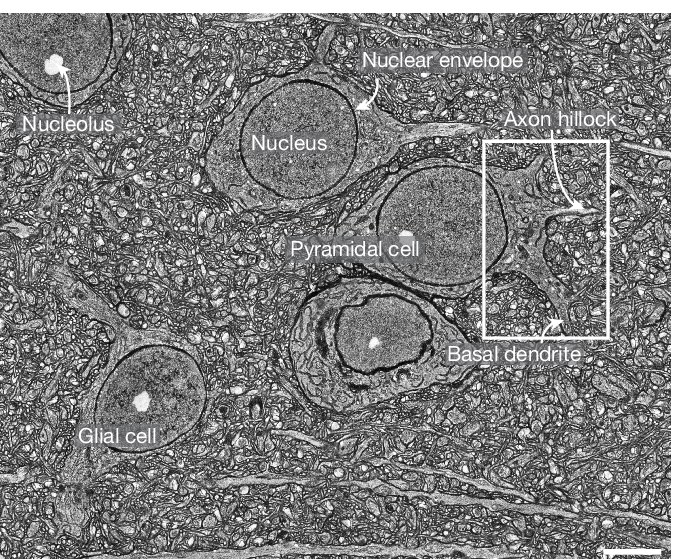
The method is LICONN, published in Nature in 2025 by the Danzl lab at ISTA with Google Research: expand the tissue, image it with an ordinary light microscope, and let the same networks that trace electron microscopy trace it. We scale it to a whole brain with a factory, not a new discovery.
- 1Fix and slice50 to 300 µm
The brain is fixed by perfusion and cut on a vibratome into slabs. LICONN used 50 µm slices and showed 300 µm with adaptations; a mouse brain is about 40 to 250 slabs depending on the thickness we settle on. Every axon that crosses a slab boundary has to be matched on the other side, which nobody has shown at whole-brain scale; step 5 depends on it.
- 2Expand sixteen-fold16x
Each slab is anchored to a swellable hydrogel, its proteins are stained, and the gel is expanded about 16x in water. A 20 nanometer gap between two neurons becomes 320 nanometers, which a light microscope resolves. The stain marks proteins broadly, so the image looks like electron microscopy: membranes, synapses, mitochondria.
- 3Image with light10 nm voxels
The expanded gel is imaged plane by plane. LICONN used a spinning-disk confocal with a water objective and reached an effective voxel of about 10 x 10 x 25 nanometers. For a whole brain we plan light-sheet microscopes, which image a plane at a time and are built for volumes this large; at LICONN's spinning-disk rate a brain is about 400 microscope-years; light sheets are far faster at lower resolution, and whether one holds LICONN's resolution sets the capital cost. Either way it needs a factory.
- 4Trace, then fix the tracingtrained on human fixes
The best published pipeline traces each neuron through the stack; today that is PATHFINDER, Google's 2025 system, which starts from its flood-filling networks and adds automated repair on top, and separate models find the synapses from their protein labels. The trace still has mistakes, a neuron cut in two or two joined, and today people find and fix them by hand. That is most of the cost. It can be automated because the fixes made to the public maps were logged, three million edits on the fly brain and a million on the mouse cubic millimeter, and about 700,000 of them have been curated into a public benchmark of proofreading decisions. A model trained on those decisions scores above the human-expert figure published with the benchmark, a small sample with wide intervals. A separate pipeline of ours, trained on synthetic breaks plus proofread labels, closed about a fifth of the breaks on nine held-out cubes of the public mouse cortex volume, none seen in training, scored once under a pre-registered protocol, while adding a few wrong joins; it did not finish the job. Closing that gap is our core work.
- 5Put it back together, labeledreceptors on the map
Slabs are registered to their neighbors so neurons continue across them. Antibodies or reporter lines in the same gel label the synaptic proteins, the cell types and the receptor we are asked about, so the finished map says not only who connects to whom but which receptor each neuron carries. LICONN imaged one drug-target receptor subunit this way, GluN1 of the NMDA receptor; no G protein-coupled receptor, the class most brain drugs bind, has been, so that is among our first measurements.
Method numbers from Tavakoli et al., Nature 2025. The slab count and the light-sheet choice are our plan; the drawings are schematic, and the tissue in the expansion drawing is a LICONN micrograph (CC BY 4.0).
Whole-brain imaging of expanded tissue exists. The resolution for wiring does not, yet.
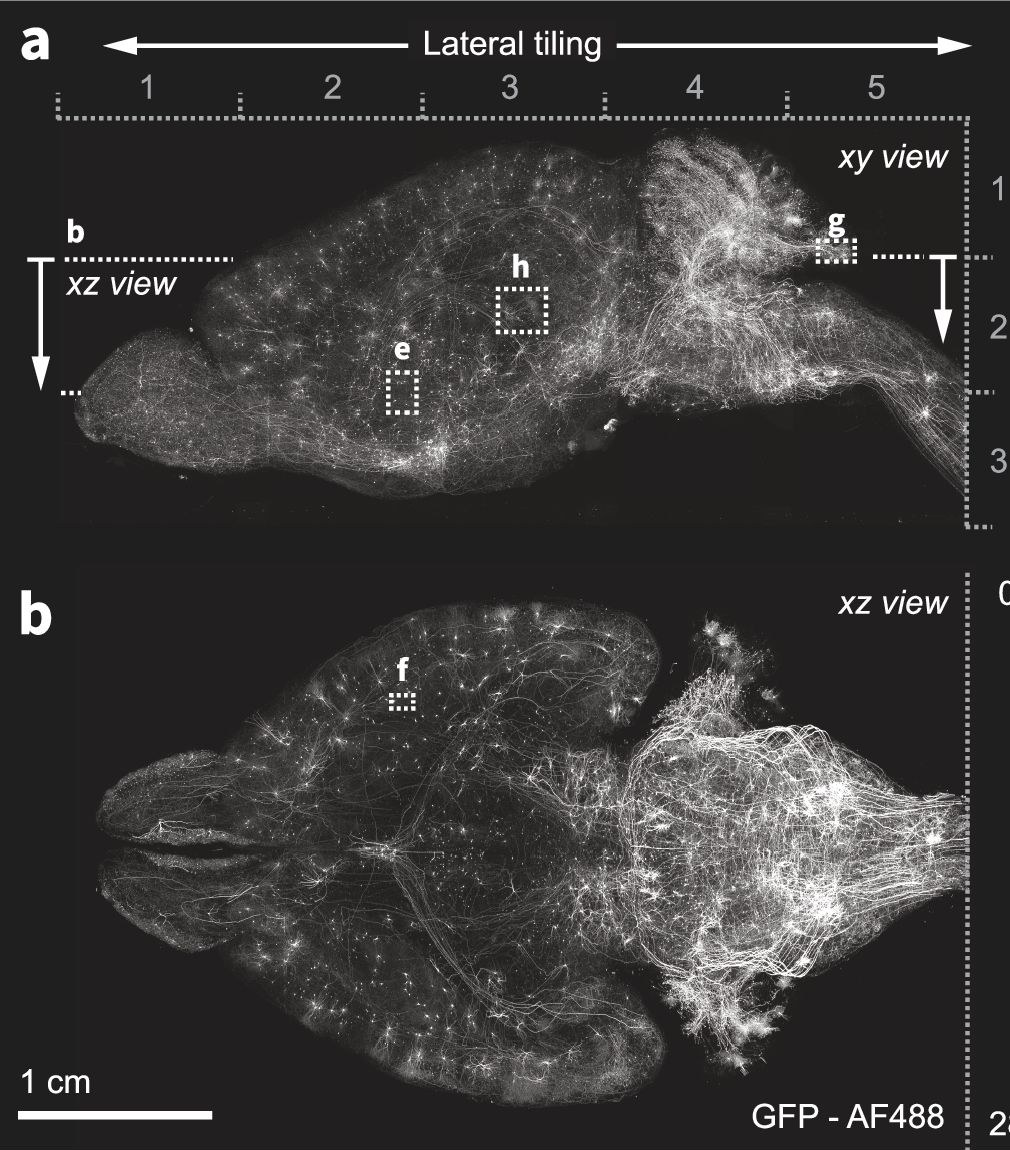
What it already does. ExA-SPIM images an entire expanded mouse brain in 15 tiles in as little as a day, without sectioning, at three-fold expansion, about 500 by 1,000 nanometers, or 375 by 750 nanometers at four-fold. With a sparse set of neurons labeled, each of them can be traced end to end across the brain, which is how complete single-neuron morphologies and projection atlases are built: a few neurons per brain, over many brains. That is real value, and it is the instrument we would start from.
Why it is not enough for a wiring diagram. The thinnest axons are 100 to 200 nanometers across and packed about 20 nanometers apart, so one 375 nanometer resolution element holds several of them. A tracer cannot follow one through the tangle or tell a synapse from a touch. Dense wiring, every neuron rather than a labeled few, has only been traced at about 20 to 30 nanometers: electron microscopy at 4 to 8, LICONN at an effective 10 by 10 by 25. The Allen instrument stops at 375 because it trades aperture for a 10 millimeter field and a 35 millimeter working distance, and resolution falls with aperture.
What sixteenfold adds. The same brain at LICONN's resolution holds every neuron, about 71 million, and every synapse, about 250 billion if MICrONS' count per cubic millimeter holds across the brain, with the proteins labeled, in one animal. A sparse brain answers one question about a few neurons. A dense brain answers the anatomical question for every neuron, once, and it is the map a model of the brain's wiring has to start from. Getting there means a light sheet at sixteenfold that holds LICONN's voxel over 64 times the volume, which nobody has shown. That is the capital problem, and the one we are organized to solve. Neuron count: Herculano-Houzel et al., PNAS 2006; synapse density: MICrONS, 523 million per cubic millimeter.
Today's costs: Wellcome, 2023, with the per-cubic-millimeter figure our arithmetic on it. Our target is a goal. Nobody has reached it.
What we will sell: the map, read through any receptor.
The test of whether we have put it back together is whether the digital brain predicts what the real one does. The first test is pharmacology. For a receptor with a reporter line or a validated antibody, or a pair of them, the map shows which neurons carry it, what feeds those neurons, where they send their output and the behaviors those circuits control. We call that an API for the brain: a map a drug developer can query, by receptor, the way a programmer queries a database.
- 1Read the map
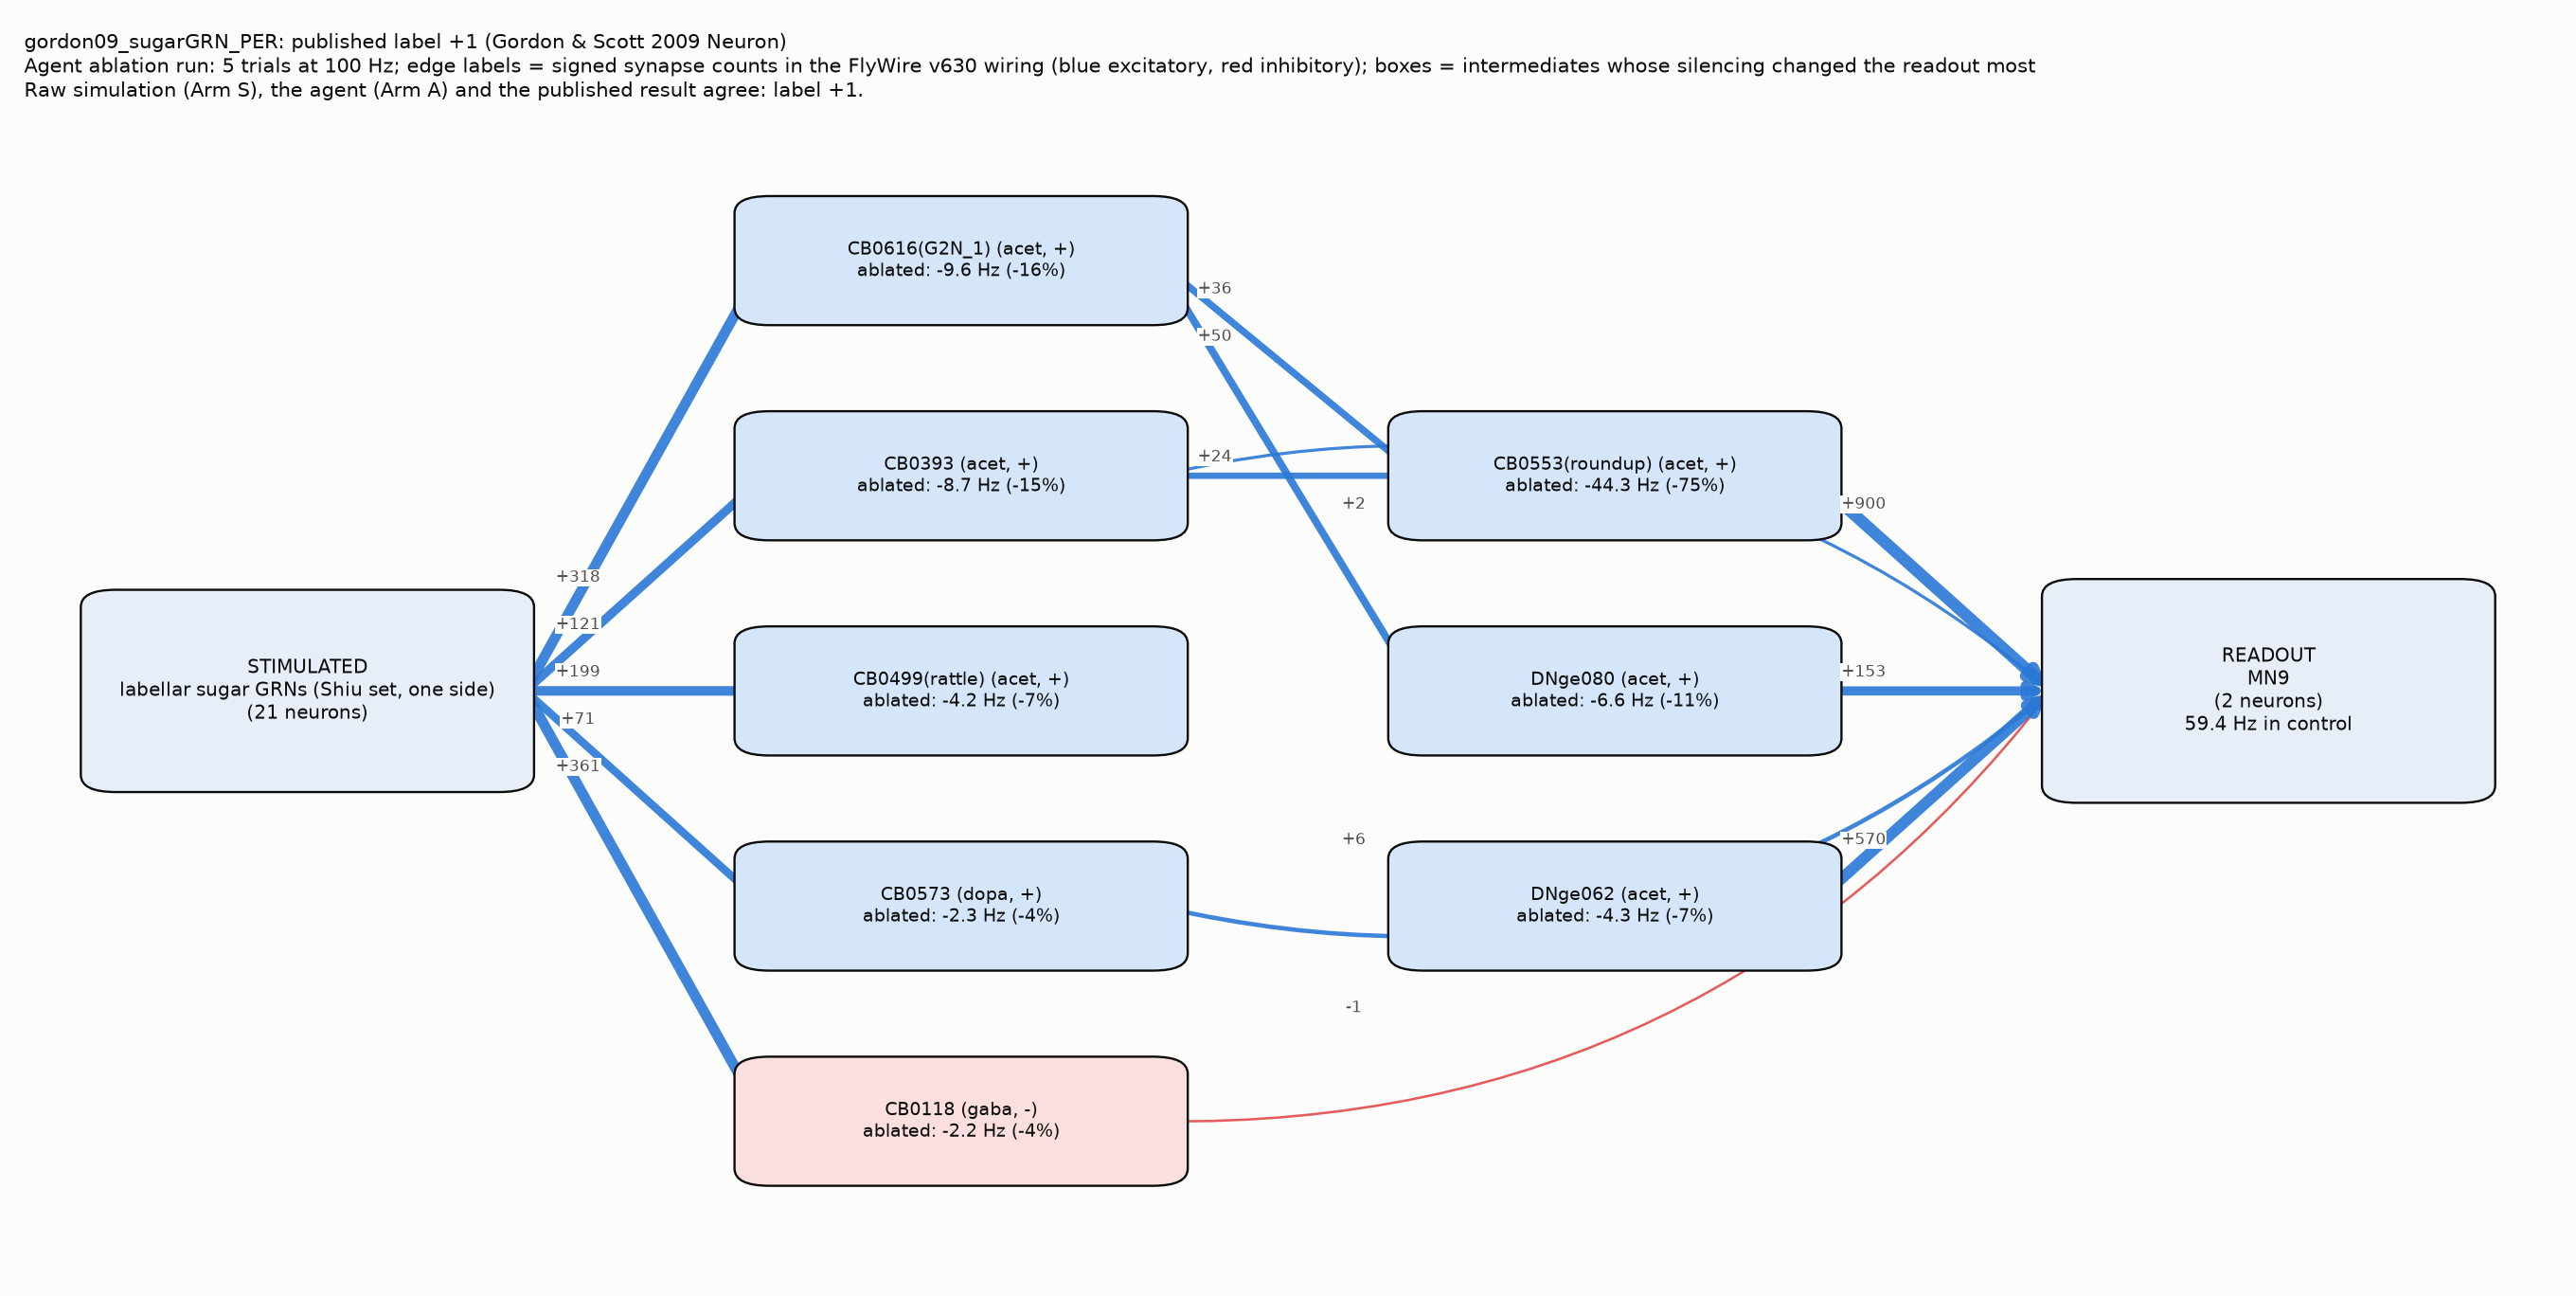
The map does not say that a receptor causes an effect. It says which neurons carry it, what those neurons connect to, and whether those connections land in circuits already tied to a behavior, such as the hindbrain nausea pathway or the hypothalamic satiety neurons. For GLP-1 that is the live question: the receptor sits on populations that drive satiety and on populations that drive nausea, and the map shows which other receptors each population carries and does not share. That is how a developer picks a combination that keeps one effect and drops the other: a ranked hypothesis with a mechanism attached, not yet a conviction. The mechanism comes from running the map as a model: agents drive the receptor's neurons in the digital brain, find the intermediate neurons whose removal changes the output, and write up what they find, the way neural networks are now read (see Reading the map, below).
- 2Dose and send
The developer doses animals with its compound and sends us the tissue.
- 3Get the difference
This is where conviction comes from. We image an activity marker in the same expanded tissue and return what changed, by cell type and circuit, against the reference and against the normal variation between animals. Individual neurons do not match from one animal to the next, so the cell type and the circuit are the units of comparison. Hypothesis from the map, test from the tissue: over many compounds, pairing the circuits a drug engaged with the outcomes it produced is what builds confidence in a target, the way the reference genome alone never found a disease gene but the genome plus thousands of comparisons did. A map is anatomy, not dynamics; it does not predict dose, timing or off-target pharmacology, and a mouse circuit is evidence about a human one, not proof.
Costs collapse when the tool changes. Reusable rockets did it for orbit. New sequencers did it for the genome. Nobody has done it for the brain yet.
Falcon 9 cut the cost of a kilogram to orbit about 20x below the Shuttle, and Starlink became possible. The sequencer changed in 2008, a human genome fell about a million-fold in twenty-two years, from the $300 million draft of 2000 to NHGRI's $525 per genome in 2022, about $560 million to about $580 in 2025 dollars, and sequencing became routine medicine. A cubic millimeter of brain map has fallen less than 10x since the first measured tracing rate in 2013, because its cost is people tracing by hand, and wages do not fall. We are changing the instrument, from electrons to light, and the labor, from people to models. Our target is the next 100x.
Reusable launch made Starlink possible, a constellation that was never worth building at Shuttle prices.
Sequencing in routine cancer care, consumer genetics, and a sequencing business of about $4 billion a year at Illumina alone. None of it made sense at $300 million a genome.
At the lower price, things worth doing with a brain map become affordable: first a study of one compound in one circuit, later whole-brain comparisons and a map for each disease model.
A complete map is the kind of thing that can now be understood.
The nearest thing to a mapped brain that exists today is an artificial neural network: every neuron readable, every connection known, every intervention possible. For a decade the field that studies those networks believed they were knots, each neuron a mixture of unrelated things, and that a second model had to be trained to untangle them before anything could be read. In 2026 that reading changed. How it changed, and what it took, is the method we will run on the brain.
Source for this section: Cammarata, Neural Networks Are Already Clean, Goodfire, 2026, an informal essay its author calls a working hypothesis. Quotations are his; the drawings are ours.
What they found when they looked again
Nick Cammarata co-wrote the papers that defined the knot view. In 2026, with better tools and a year of automated scientists, he went back to its evidence and found it was misread. The famous neuron that fired for both cat faces and the fronts of cars is a detector for a V shape, which fox faces, flames and the fronts of vans share; its opposite is a round O. The circuit that seemed to hide a car among dog neurons was a shared-pose circuit nobody had noticed. The last layer of the field's old model organism, where almost no neuron could be read, was the product of an architecture that learned badly: trained again with the ordinary improvements of the following decade, same size and same data, 99 percent of its last-layer neurons are legible.
In a 32-billion-parameter language model his audits find about 90 percent of neurons with one main job, 7 percent with two related jobs and 2 to 4 percent not yet understood; agents wrote a thousand neuron-by-neuron investigations and traced attribution graphs in models up to a trillion parameters. What remains of the mixing is a motif he calls recursive generalization: a neuron that learned "iy" grows to "diy" and then to "do it yourself", which contains no "iy" at all. Related things share a neuron because they are related. There is something to learn from the grouping.
“Polysemanticity is often more a claim about the observer than the neuron. It says there's no good explanation yet.”
Why the whole map beats the circuit you care about
The essay's second argument is the one that answers the question we are asked most: why map a whole brain when a drug program cares about one circuit? Because understanding compounds. A neuron explained constrains its neighbors; an attribution graph explained constrains the next one; the unexplained remainder points at the tool that is broken. Starting from one circuit in an otherwise unmapped network gives nothing to check the explanation against.
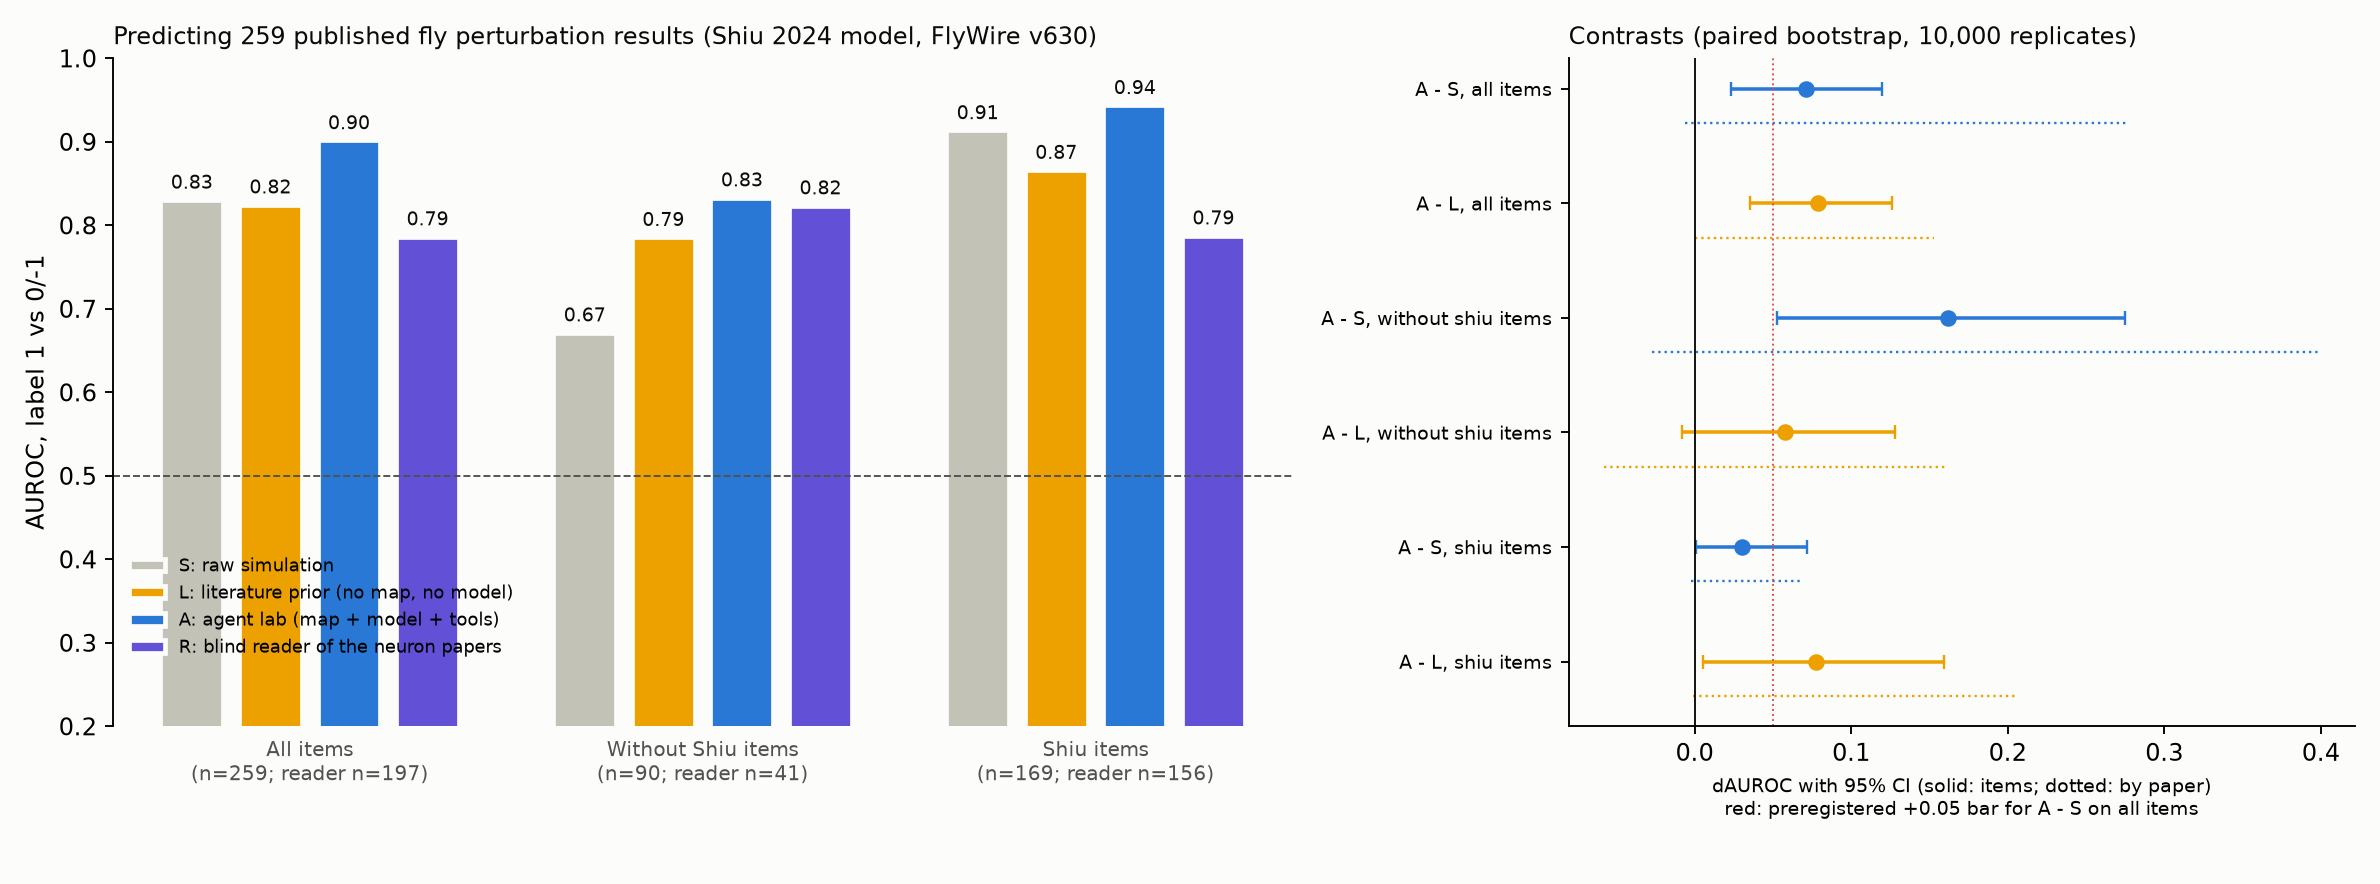
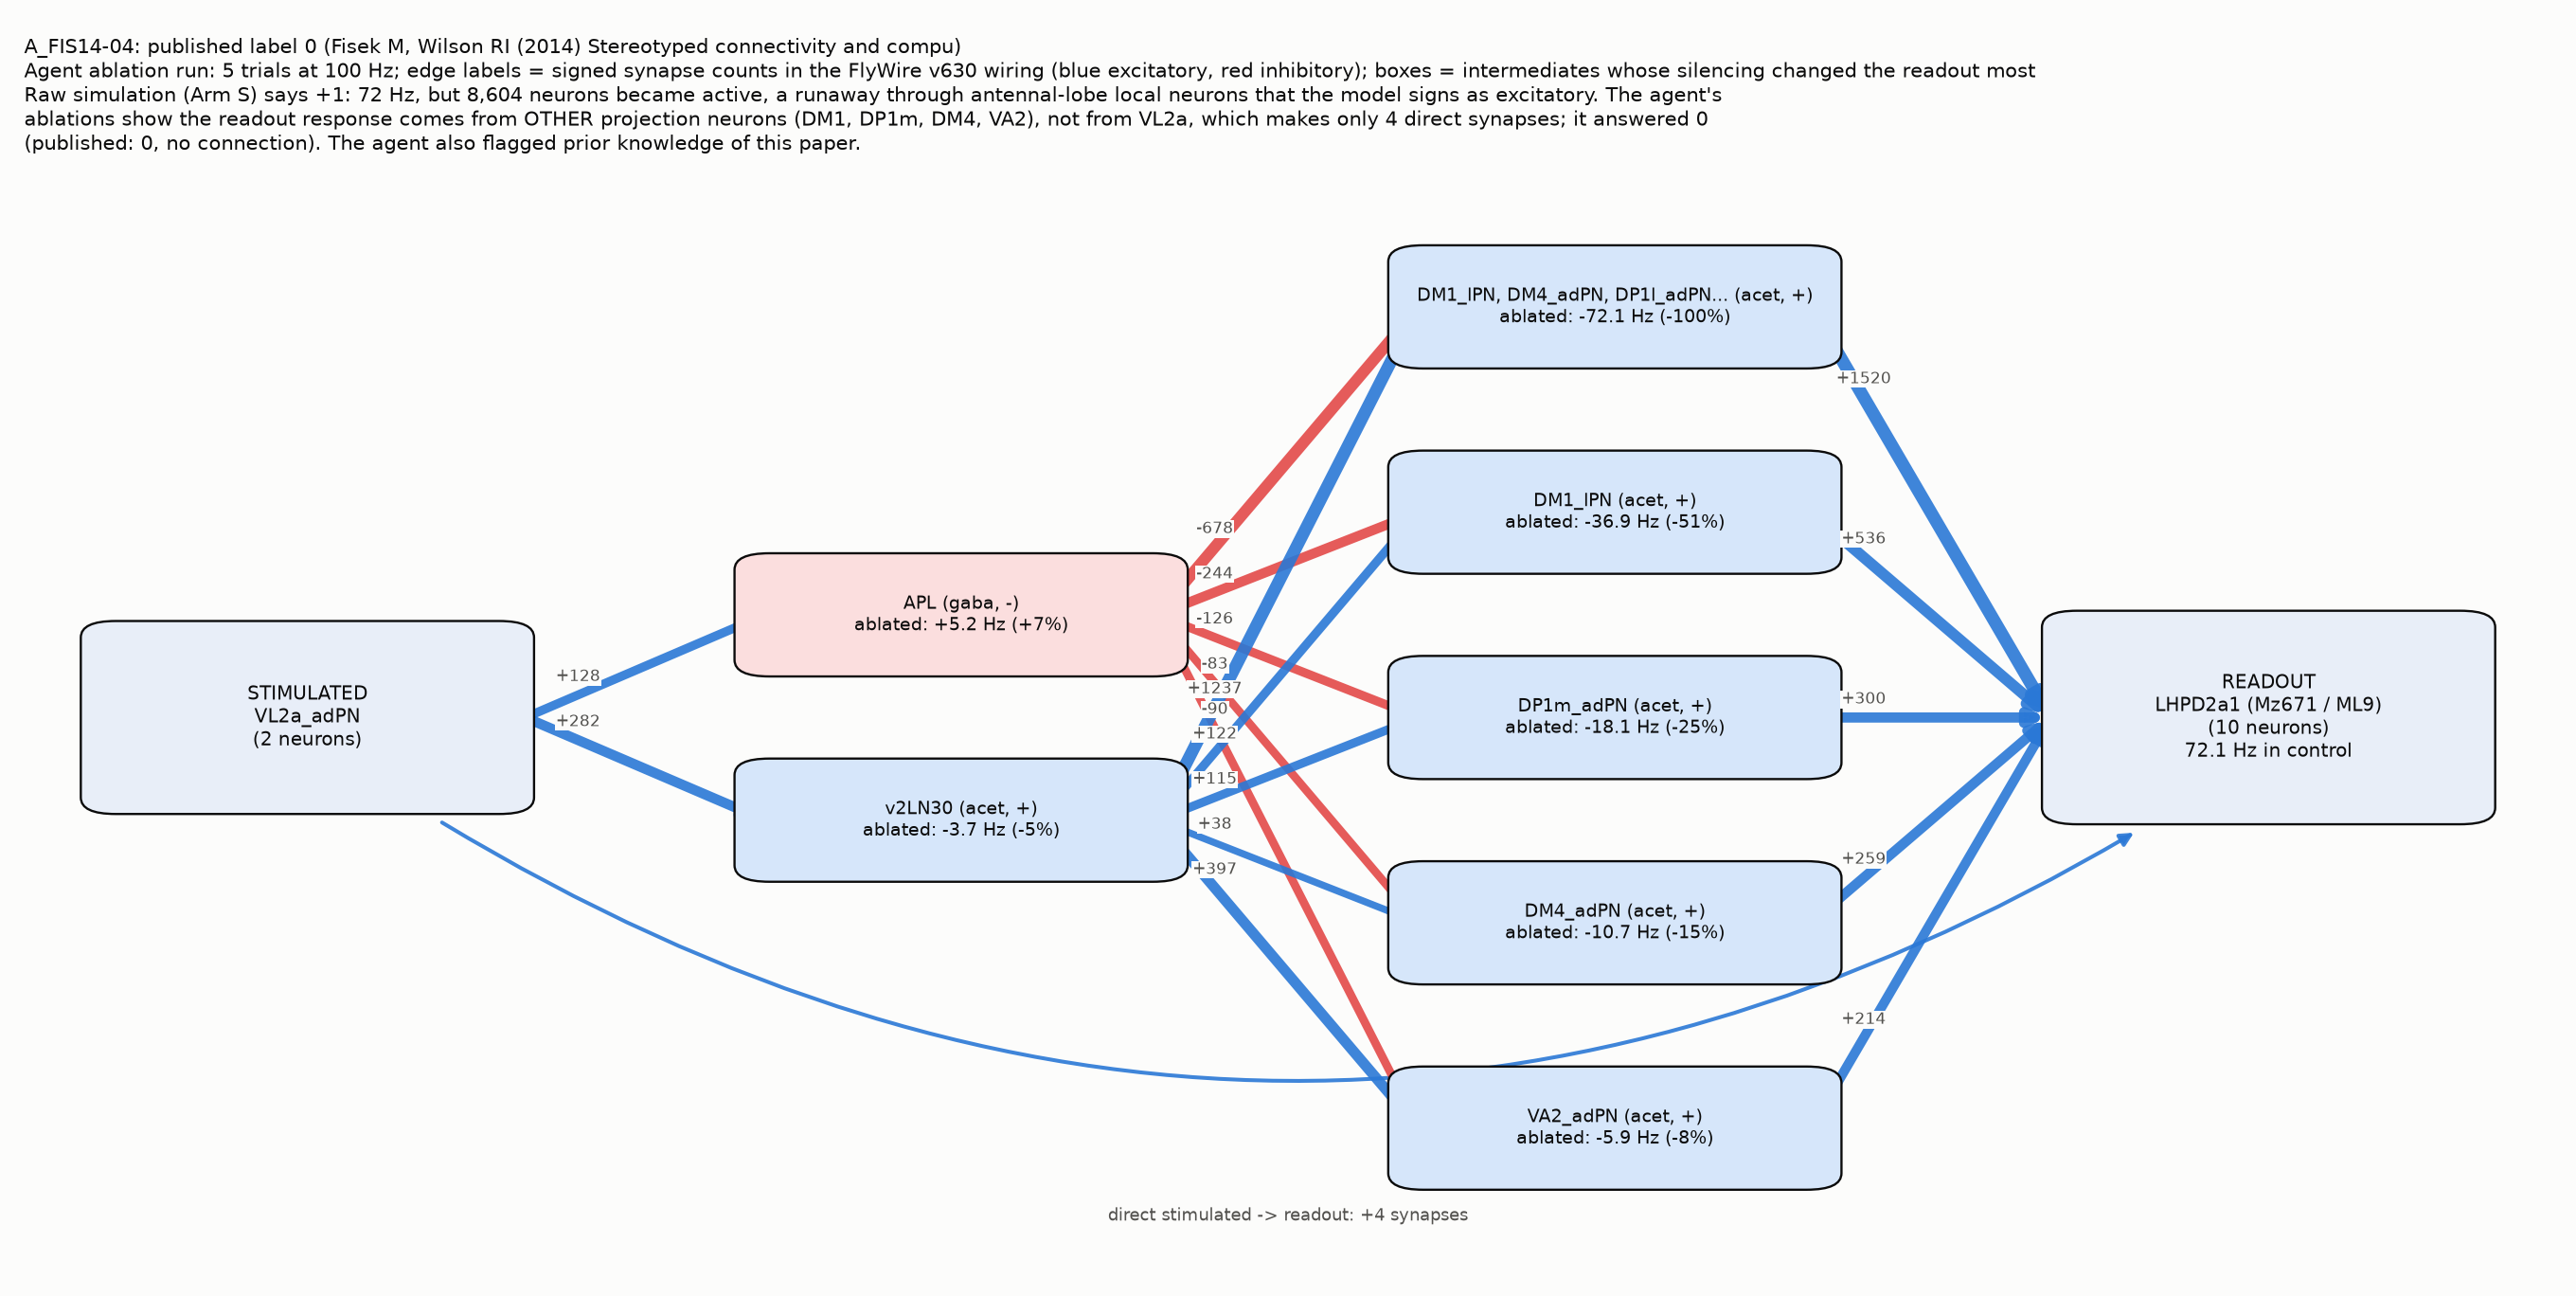
We have a measured parallel of our own. In a published whole-brain model of the fly, built on the FlyWire connectome, we blurred the wiring to the resolution a regional atlas gives and asked whether the model still predicted 259 published activation and silencing experiments from 24 papers. It did not: neuron-level wiring scored 0.83 AUROC and region-level wiring 0.51, chance, on all items, and 0.67 against 0.51 on the 90 experiments the model's authors had not used to build it. Activity still spread through the blurred brain; it almost never reached the right neurons. The essay's advice, to work at the network's own units and not to fracture it into ours, is what the fly says too.
“Targeting a small set of mechanisms is like working on one row of an otherwise empty crossword. It's doable, and might work, but without the crossings it's hard to know whether you're right. It may be easier to solve the whole thing.”
How the reading is done, and what it becomes on a brain
The method is ordinary science run by agents at scale, and each step has a direct analog once a brain exists as a model. A neuron paper: one investigation per unit, of what drives it, what inhibits it and through which intermediates. An attribution graph with the network's own neurons as its nodes, from an input to an output, checked by removing nodes: in one example, removing four hub neurons changed a model's medical diagnosis, and removing eight neurons whose negative side was about Santa dropped the model's answer "Santa" from near-certain to 6 percent. An explanation that can lose: a second agent, seeing only the first agent's written explanation of a neuron, writes an input meant to drive it, and in 164 of 183 cases the explanation beat its near misses. Recurring patterns of connections, mined from 25,000 attribution graphs, predicted where removal would hurt far better than patterns of activity did.
On a brain the nodes are neurons and cell types, the input is a receptor's population driven in the digital brain, the removals are silenced intermediates, and the second agent predicts an experiment a customer has not yet run. The customer's dosed tissue, imaged against the reference, is the test the explanation can lose. That is the product: not a lookup in a map, but a mechanism with its evidence attached, read by anyone who can read.
“We've always had the best laboratory in natural science: every neuron can be read, every intervention made, every experiment rerun on an identical copy. What we did not always have is many automated scientists to work in it, far faster and in far greater numbers than we can. Now we do.”
What it does and does not say about a brain
Everything in the essay rests on being able to run the experiments: stimulate, remove, rerun. A fixed brain gives structure and one snapshot of activity, so the experiments run on the model built from the map, and the tissue is what checks the model. The essay is also explicit that it is a working hypothesis about artificial networks, its author's own confidence about 85 percent, with a technical companion still to come, and it argues against part of its own field. On brains the author is a bystander and says so: the transfer is his guess, and the counterexample he names, neurons in the brain that respond to many unrelated things, is a real literature, mixed selectivity in prefrontal cortex above all. Whether that is the brain's cat-and-car neuron, a shared pattern misread through a few electrodes, or the real thing, is a question a complete map and a model of it can ask and a few electrodes cannot.
What we take from it is narrower than its title. A complete network of this kind, read with these tools, has turned out to be legible, and the more of it that is read the easier the rest gets. If the brain is organized the same way, the map we are building is the start of understanding it, not only of simulating it. That is a hypothesis about the brain. We would rather test it than assume either answer.
“The circuit ecology story for why networks are clean relies on very little: generalization, composition, and an error signal. I don't know to what extent the brain has these, but if it learns, I'd guess it has something like them. So my default is now that the organizing principle transfers, even though the mechanics are obviously unclear. The obvious counterexample would be polysemanticity in the brain.”
Our tests, pre-registered: the map and model add a modest real gain, the model's memory of the literature adds about as much, and a neuron paper per cell type carries the whole gain
We ran the essay's playbook on the one brain that already exists as a complete model: the Shiu et al. 2024 whole-fly-brain model on the FlyWire connectome, 127,400 neurons, every one of which can be driven or silenced in software. Agents with the wiring and the simulator investigated each of 259 published experiments from 24 papers, wrote up the mechanism and predicted the result. A control arm with no access to either measured how much a language model guesses from the names alone. The bars, arms and scoring of every test below were frozen before the first run, and each is reported pass or fail.
First test, passed, then qualified. The agents scored 0.90 AUROC against the raw simulation's 0.83, a gain of +0.07 with a 95 percent interval of +0.02 to +0.12, above the +0.05 bar; a second lab's model, run through its own agent tool, scored 0.91 on the same experiments. Then we reran the agent with every neuron name, transmitter and brain region replaced by an opaque code, so it could read the wiring and run the model but could not recognize the paper. The gain fell to +0.04, below the bar. On the 169 experiments the model's authors had used to validate it, the blind agent gained nothing over the simulation; on the 90 they had not, it gained +0.09 with an interval of +0.04 to +0.15. That +0.09 is what the map and the model add on their own. The names-only control gains about the same by a different route, remembering the literature, and the two add. We then asked whether that was memory of the papers or knowledge of the biology. Hiding only the paper-identifying text while keeping the names cost nothing, and keeping transmitter, region and the design notes without the names did not recover the gain: the cell-type names themselves carry it. Models trained before the papers existed scored far lower, but just as much lower on 2026 papers no model has seen, so most of the gap is capability. Asked directly, the model names the right paper for 85 percent of the experiments but recalls the right result for about half of them. It recognizes the paper, not the answer.
We tried to get around the memory problem with newer papers and could not. A key of 53 experiments from 12 fly papers first published in 2026, after the model's training data was collected, was still predicted at 0.82 AUROC by the names-only control, because 2026 fly results are guessable from the names and the design of the experiment. The clean test is an experiment without precedent, which is what a customer's unpublished compound is.
Second stage, neuron papers. Agents wrote a paper on each of 350 cell types around the fly's feeding motor neuron from the model alone, and a fresh agent reading only the papers predicted the experiments. With the full library the reader scored 0.90 on all 259 experiments, equal to the agent with the tools and above both the simulation and the names-only control. The agent given the tools and the library did best, 0.96 on the primary 136 experiments against 0.90 for either alone, with the interval just clear of zero. The gain arrived with each experiment's own paper: withholding it and supplying the neighbours' papers gave nothing, so we found no compounding across cell types yet. On the essay's near-miss test the papers won 346 of 350 and lost none, with the caveat that most of our true statements are 'no effect'.
Third test, the mouse, failed as expected and informative. On the MICrONS cubic millimetre, 3,000 cortical neurons with recorded responses, 1,309 of them orientation-selective, an agent given each cell's wiring and every other recorded cell's tuning predicted its orientation no better than a rule using where the cell sits: median error 25.8 degrees against 25.3, a difference of +0.5 with an interval of -1.6 to +3.0. The agent restricted to the wiring alone did worse, 29.4, and a names-only control sat at the base rate, 34.8, so on the mouse nothing came from memory and the map was the only source. In a map with one snapshot of activity and no way to run experiments, function in cortex is read from location, not from the readable wiring. That is the map-to-model gap measured, and why the fly, where the model exists, comes first.
Finally the product artifact. A GABA-receptor antagonist, modelled as a gain on the 15,030 neurons the model signs GABAergic, run across 18 standardized assays at four doses: six readouts changed at the working dose, nine did not, and full block was a brain-wide runaway, the model's version of a convulsant. Agents traced every effect to a few named inhibitory neurons the compound released and wrote the tissue predictions as a table, each with what would refute it. The first test cost $100 in model calls; the rest ran on subscription accounts for nothing more, on one computer and one GPU, in a night.
Key enabling technologies, published in 2025 and 2026, and a data scaling law we validated ourselves.
Four results from other labs make a whole mouse brain at this resolution a program rather than a wish, a fifth says a complete network can be read once it exists, and one measurement of our own says the last human step in the pipeline is giving way to models. None of the five is ours. The sixth is.
- 1Nature, May 2025
A wiring diagram from a light microscope
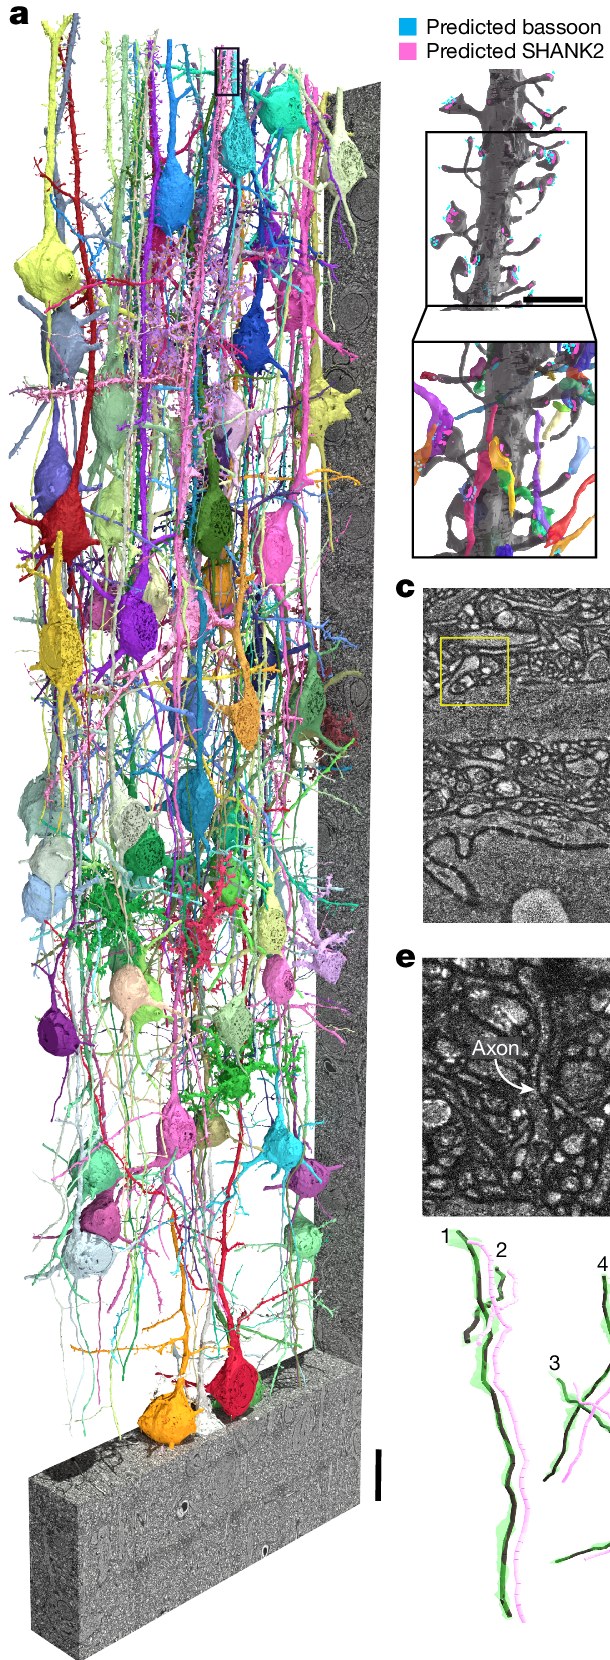
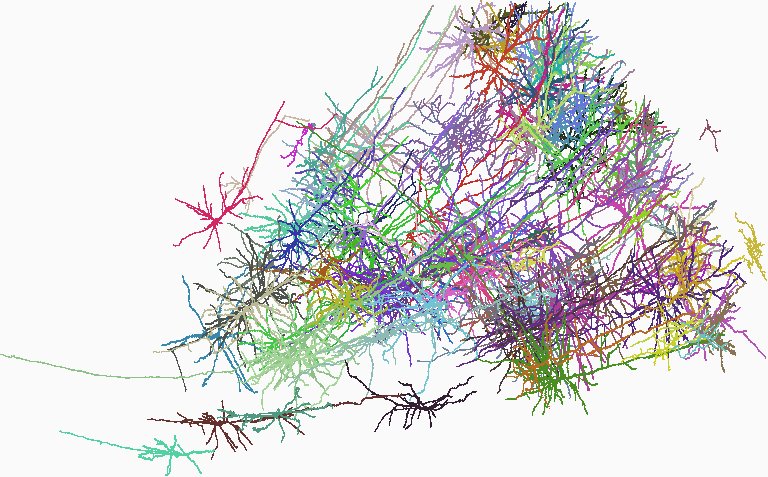
LICONN, from Johann Danzl's lab at IST Austria with Google, expanded mouse cortex sixteen-fold in a hydrogel, stained every protein, and imaged it on an ordinary spinning-disk confocal at an effective voxel of 10 x 10 x 25 nanometers, about 20 nanometers of resolution in the plane. The automated tracing reached an accuracy its authors call comparable to electron microscopy's, on volumes up to a thousandth of a cubic millimeter, with the synapses and the cell-type proteins labeled in the same gel. Until this paper a dense wiring diagram needed an electron microscope. The figure beside is what it produces. Tavakoli, Lyudchik, Januszewski et al., Nature 2025.
- 2eLife, 2025
A whole expanded brain imaged in a day
ExA-SPIM, from the Allen Institute, images a whole mouse brain in about 24 hours on a light-sheet microscope, at three-fold expansion for the whole-brain run (about 500 by 1,000 nanometers) and 375 by 750 nanometers at four-fold: enough to follow every cell's long projections, and not yet enough for synapses, which sit 20 nanometers apart. The optics and the sample handling for whole expanded brains exist; what is missing is the sixteen-fold expansion and the resolution that comes with it, and that is the microscope we have to build. Glaser, Chandrashekar et al., eLife 2025.
- 3bioRxiv, May 2025
Tracing that repairs its own mistakes
PATHFINDER, Google's current reconstruction pipeline, starts from its flood-filling networks and adds two models that propose and check repairs to the automatic trace. On a 676,000 cubic micrometer block of mouse cortex it raised the expected error-free run length of its axon traces, the field's standard score, from 82 percent for its flood-filling baseline to 94 percent (Table 1 of the preprint), which its authors put at 84 times the proofreading rate Wellcome's 2023 report assumed, counting ten seconds per automated fix. The remaining errors are what human proofreaders fix today, and they are what our own models go after. Januszewski et al., bioRxiv 2025.
- 4E11 Bio, 2025
Cells that label themselves
E11 Bio's protein barcodes give each neuron a combination of tags that the tracer can read, so a wrongly joined pair of cells announces itself. Shown at fivefold expansion on a hundredth of a cubic millimeter. Nobody has shown barcodes at sixteen-fold, and nobody has shown they are needed once the tracing is good enough; whether they help at our resolution is the first thing we measure. E11 Bio, PRISM.
- 5Goodfire, 2026
Agents that read a complete network, neuron by neuron
Nick Cammarata's essay Neural Networks Are Already Clean, from the interpretability company Goodfire, reports what happens when every neuron of a network can be read, every one can be removed, and automated scientists run the experiments: the network turns out to be organized rather than knotted, and the map fills in faster as it goes. In its audits of Qwen3-32B about 90 percent of neurons have one main job, 7 percent two related ones and 2 to 4 percent are not yet understood; agents produced a thousand neuron-by-neuron investigations and traced attribution graphs in models up to a trillion parameters; and the field's canonical evidence that neurons mix unrelated things, the cat-and-car neuron, turned out to detect a V shape. What matters to us is the method, not the models. It is how a digital brain gets read once it exists, and the author's own guess, offered as a non-neuroscientist, is that the organizing principle transfers to brains. That is a hypothesis about artificial networks until it is tested on a biological one; our test, on the fly, is described under Reading the map above. The essay is a working hypothesis, not a peer-reviewed result, and says so. Cammarata, Neural Networks Are Already Clean, Goodfire, 2026.
Our own measurement: the human step scales away with data
Human correction of the computer's tracing is where the cost is. To test whether models can take it over, and how fast they improve, we trained our own: a small image model, 7 million parameters, fine-tuned on the public benchmark of proofreading decisions, which is built from the logged corrections of the fly and mouse maps.
It scores above the published human-expert level on both tasks: 97.4 percent against 93.0 on split correction, and 94.4 against 84.1 on merge identification, level with the benchmark authors' own models (their best, 97.2 and 93.0, on their held-out split). The human figures come from a small sample with wide intervals, so on split correction call it a match, and on merge identification a clear lead. Its error falls as a power law in training data, with exponents of 0.20 and 0.16, and has not leveled off: every doubling of labels cuts the error by about 13 and 11 percent, a small, predictable gain, which is the property a factory needs and not, on its own, the whole plan.
The same model, trained only on electron-microscopy reconstructions, also transfers to expanded tissue: applied to E11 Bio's expansion data with no retraining it scores 0.70 AUROC against 0.50 for chance, starting from it is worth four to eight times as many labels as starting from scratch, and its accuracy rises with every label added. The data from the old method trains the models for the new one, so a company can start on public electron-microscopy data and finish on light.
Scoring decisions on a benchmark is not finishing a brain. A separate pipeline of ours, scored once under a pre-registered protocol on nine held-out cubes of the public mouse cortex volume, none seen in training, closed about a fifth of the breaks while adding a few wrong joins; only 269 of the 20,578 joins it made fall where proofread cells allow a check (238 right, 31 wrong), 95 percent land where nobody has proofread, and the image-based second stage we pre-registered did not meet its own success rule. That is the gap the company exists to close, and the scaling law says how. Anyone can rescore it: the evaluation, with its pre-registration, outputs and scoring code.
Public funding is thin. NIH funded two mouse centers to image about 10 cubic millimeters each by 2028, about 4 percent of a brain between them, and the Harvard one's grant was terminated in May 2025 and restored later that year (NIH RePORTER lists an FY2025 award notice dated August 21, 2025, and the FY2026 award; Harvard's reinstatement notices followed the court ruling of September 3, 2025). No public program is funded to map a whole mammalian brain. E11 Bio, a nonprofit funded by philanthropy, is working toward a whole mouse brain and publishes its methods; we are building the commercial factory, and the pharmacology product, that an open method makes possible. NIH RePORTER, UM1NS132250.
Three markets, each bigger than the last.
We sell to them in the following order.
- Market 1 of 35.9%neurology drugs approved from Phase 1Pharma's decisions
Neurology drugs have one of the lowest approval rates in the industry, 5.9 percent from Phase 1 against 7.9 percent for drugs overall. From 2027 we sell those programs regional studies: the customer's treated and untreated animals, one circuit, receptor labeled, compared against the reference, at prices that rise once a study has changed a program decision. Later come platform deals of the kind pharma already signs for other kinds of biological maps (Recursion received $150 million upfront from Roche; Cerevance $25 million upfront and up to $1.1 billion in milestones from Merck) and, once a brain costs under $1 million to produce, whole-brain comparisons and simulations built on the accumulated brains.
Source: BIO, clinical development success rates 2011 to 2020.
- Market 2 of 33.4Bpeople with a brain or nervous-system disorderThe drugs themselves
Brain and nervous-system disorders are the leading cause of ill health worldwide, affecting 3.4 billion people (GBD 2021; the count includes migraine and tension-type headache), and the incretin drugs, GLP-1s among them, are forecast at $200 billion a year by 2030 (J.P. Morgan Research, February 2026). If brain diseases ever become as treatable as infections, those drugs will be the biggest category in medicine, and they will be designed against a map.
Sources: GBD 2021 and J.P. Morgan Research.
- Market 3 of 38.3Bpeople whose lives could be extended indefinitelyThe mind itself
A model good enough to predict what a drug does is a first step toward a model that runs on its own. If a human mind can one day be reproduced outside biology, that is a path to extending human life indefinitely.
Source: UN World Population Prospects 2024, 8.3 billion people in 2026.
Building a world-class team.
Brain Insights will be built by the people behind the breakthroughs it rests on: the automated reconstruction that cut proofreading by orders of magnitude, the expansion chemistry that put a wiring diagram in a light microscope, the light sheets that image a whole brain in a day, and the methods that read a complete network neuron by neuron.
Co-founders
The founding team will lead our efforts to understand and recreate the brain, starting with one whole mouse brain. We offer very generous equity and meaningful impact on the direction of the company.
- OpenReconstruction and AI
Has built automated reconstruction that runs at petabyte scale and wants to take the last human step out of it. Owns the models, the benchmark and how we score ourselves.
- OpenExpansion and imaging
Has made expansion chemistry hold up at connectomic resolution, or built a light sheet that images a whole brain, and wants to run both as a factory at sixteenfold.
- OpenCircuits and pharmacology
Knows the circuits behind appetite, nausea, reward or sleep, and wants to turn a map into readouts a drug program can act on.
- OpenReading the model
Has read a trained network at the level of its own units, with attribution graphs, ablations and agents that write and test explanations, and wants to do it on a brain. Runs the fly test now and decides what a readout is before the mouse map exists.
- The whole loop, under one roof
- Today a brain gets mapped by a relay: one group prepares the animals, another builds the microscope, another writes the reconstruction, another asks the biological questions, and each hands off to the next. Here one team owns the loop end to end, from the animal to the model, and then runs that model for customers: tissue, instrument, reconstruction, readout and the product built on it.
- One brain, run as a program
- The goal is a whole mouse brain on a timeline set by engineering, not by grant cycles.
- The long question
- If the map is good enough to predict what a drug does, it is the first step toward a model of the brain that runs on its own. The company is organized to find out.
Interested in one of these roles, in investing, or in a study of your compound? Talk to us: a short form, and a person replies.
Dan has been passionate about the intersection of computer science and neuroscience since he graduated from Stanford in 2005. Since then he has built two successful companies and gained the right experience to prepare him to lead this third, and most ambitious, endeavor.
In 2010, he co-founded Optimizely, a platform to democratize the scientific method. He grew it to 450 employees and $120 million in annual recurring revenue, a B2B software business with thousands of customers, some paying more than $1 million a year, and sold it for $300 million.
In 2018, he co-founded the Mind Emulation Foundation to fund and conduct scientific research in order to accelerate our path toward human mind emulation.
In 2020, he co-founded Limitless, a consumer AI hardware company whose Pendant was one of the most successful AI wearables in the world. He led a team that built hardware for 1/100 of the cost and 1/5 of the time that companies like Meta spend on hardware. Meta acquired Limitless in 2025.
Dan has raised over $250 million in venture capital from top-tier investors like a16z, Benchmark, First Round Capital, Y Combinator, and Sam Altman.
To the extent that Dan has been successful in his career it is because he has recruited a world-class team of experts in different fields and created a culture that enables them to reach their full potential.
Understand and recreate the brain.
By 2033 we will have mapped one mouse brain, and a factory will be producing comparisons against it for paying customers. After that, brain drugs can be designed against a map rather than guessed at, and because maps are cheap, each disease model can have its own.
That is only the first step. Each brain we map lowers the cost of the next and improves the models, and the same methods apply to a human brain, 2,000 times larger and decades beyond this plan. The 2026 result on artificial networks says a complete, readable network becomes understandable as the map fills in, and that the bigger it is the more each explanation is held in place by the rest; if the brain is organized the same way, which is a hypothesis we intend to test, the map is the start of understanding the brain, not only of simulating it. If a mind can one day be rebuilt in software, a life no longer has to end when the brain wears out. The odds of success for this long-term vision are low and the journey will be long. But we are pursuing it anyway, because at a minimum it will further our understanding of the brain, and if we are successful it will be a tremendous benefit to humanity.
The hard questions, answered.
We recognize that what we are proposing to do is ambitious and our success is not guaranteed. Here are answers to the most common questions and concerns about our plan.
One cubic millimeter cost $100 million. How can 500 of them cost less than that?
Because almost none of that cost was the imaging. The MICrONS program paid for a first-of-its-kind electron microscope pipeline, two-photon functional imaging of the same tissue, and the years of human proofreading that are still going on. Wellcome's $7.5 to 21.7 billion for a whole brain is explicit that almost all of it is wages for people correcting the computer's tracing.
So the target is really two numbers. The instrument: a light microscope on expanded tissue costs hundreds of thousands of dollars, a multibeam electron microscope millions, and LICONN has shown the light image is good enough to trace. The labor: the fraction of corrections that a model makes instead of a person. Our target of under $100 million requires that fraction to be close to all of them. It is a goal, stated as one; the scaling law on the Why now page is the evidence that it moves with data, and the first two years of the plan are spent measuring how far.
Two clarifications a careful reader asks for. First, $100 million is the production cost of a brain once the factory runs, not the company's budget; the factory, the instrument development and the first brain's mistakes are capital, and the plan raises for them separately. Second, the 100x is measured against Wellcome's estimate of what making one costs by the published method today, since nobody sells one; electron microscopy will also get cheaper as proofreading automates, and the honest comparison in 2033 is against that. Light still wins on three things that do not change with software: the price of the instrument, the thousand-fold fewer sections to align, and the proteins imaged directly in the same gel. Wellcome's other lines shrink with it: its $200 to 300 million for imaging was twenty multibeam electron microscopes at about $5 million each for five years, and its $300 to 400 million for registration and segmentation was priced in 2023 against thirty-nanometer sections. Light instruments cost a tenth as much, cloud compute is cheaper every year, and slabs a thousand times thicker mean a thousand times fewer alignments. Those lines are in our budget at their measured values, not Wellcome's. And PATHFINDER's gain on proofreading is inside our hundred-fold, not competing with it: the target counts every published advance we can use, and the company's own work is the part that remains after them. Take its projection at face value: if its 84-fold held for a whole brain, Wellcome's proofreading line falls to roughly $0.1 to 0.3 billion, and what is left is the $0.5 to 0.7 billion of electron-microscope imaging, registration and segmentation, which is exactly where light's instrument price and thousand-fold fewer sections take over. The hundred-fold is against the estimated cost of making one today, because no brain has been made; against an electron-microscope factory of 2033 the edge is the instrument, the sections, and the proteins in the gel, and we would rather say that than pretend the other factory stands still.
Light microscopes cannot resolve synapses. Why do you say they can?
They cannot in native tissue; two neurons sit 20 nanometers apart and light resolves about 250. Expansion microscopy swells the tissue in a hydrogel, and at sixteen-fold the same gap is 320 nanometers. The gap is the easy part of the criterion. What decides whether a volume can be traced is separating the thinnest, densest axons, about 100 to 200 nanometers across, which become 1.6 to 3.2 micrometers in the gel, and whether the synapses can be found, which LICONN does from their marker proteins rather than by resolving the cleft. LICONN, published in Nature in 2025, did exactly that: stained proteins broadly so the image shows membranes and organelles the way an electron micrograph does, reached an effective voxel of about 10 by 10 by 25 nanometers in tissue units (about 20 nanometers of resolution in the plane), and traced the result automatically at an accuracy its authors call comparable to electron microscopy's.
What LICONN has not done is a whole brain. Its volumes were up to a thousandth of a cubic millimeter on a spinning-disk confocal. The whole-brain light-sheet microscopes that exist, the Allen Institute's ExA-SPIM, image a three-fold expanded brain in a day at about 500 by 1,000 nanometers, or 375 by 750 at four-fold, which shows projections but not synapses. The microscope we have to build is the one in between: a light sheet that holds LICONN's resolution over a sixteen-fold expanded brain. That is an engineering program, not a discovery, and it is the first capital we spend.
At LICONN's imaging rate a brain is 400 microscope-years. Doesn't that end the plan?
The arithmetic is ours and it is on the page: LICONN imaged 0.95 million cubic micrometers of tissue, measured before expansion, in 6.5 hours, so 500 cubic millimeters of brain, which is 2 liters of expanded gel, is about 400 instrument-years on that microscope. Even at that rate it is a factory problem, not a physics problem: a hundred instruments for four years, at a price per instrument far below one multibeam electron microscope.
A light sheet illuminates and images a whole plane at once, where a spinning disk scans the plane with hundreds of points at a time, which is why ExA-SPIM does a whole expanded brain in a day. Its published rate is 946 million voxels a second, about 55 times LICONN's confocal, measured at its own coarse resolution; if a light sheet held that rate at LICONN's voxel size, the brain would be about seven instrument-years per channel, our arithmetic, and ten instruments would image it in under a year. It will not hold it unchanged: finer resolution means thinner sheets and fewer photons per voxel, so the real rate at sixteen-fold will be lower, and how much lower is the first-year measurement that sets the instrument count. If it can, the imaging budget is small; if it cannot, the confocal factory still fits. Which one we build is decided by measurement in the first year, not by hope.
Tissue has to be cut into slabs, and every axon crosses the cuts. Isn't registration the unsolved part?
Yes, and the page says so. LICONN expanded 50 micrometer slices and showed 300 micrometers with adaptations, and it demonstrated a partial answer of its own: image an expanded slab, remove the imaged layer, image deeper with overlap, and fuse the volumes, twelve rounds over about 205 micrometers of native tissue, so the continuity problem inside a slab is solved by overlap. What remains is the cut made before expansion; a brain is tens to hundreds of slabs, every cut face carries on the order of a hundred million axon crossings, and every one has to be matched to itself on the other side. Electron microscopy has the same problem at every one of its 30 nanometer sections and solves it with alignment software; ours are a thousand times thicker, so there are a thousand times fewer boundaries, each one harder, since Wellcome's report notes that thick-section interfaces lose more tissue at the cut and are harder to align than ultrathin ones, which is why the plan measures the error per crossing rather than assuming it. The long projections, which whole-brain light-sheet imaging already follows across a brain, constrain the match for the axons that cross the most faces.
There is a trade inside it that we state plainly: a thick slab means fewer crossings to match but needs an objective with a long working distance at high numerical aperture, and a thin slab the reverse. The slab thickness, the objective and the measured error per crossing are first-year measurements, and the barcode question (whether E11 Bio's self-labeling cells are needed to make matching reliable) is the first experiment we run. A barcode does not have to be unique among 71 million neurons, only among the few axons that meet at the same spot on a cut face, which is why a library of a hundred thousand can serve a whole brain.
Your model matches the benchmark authors' own model and beats a small sample of human experts. What does that prove?
Not that we are ahead of Google; the benchmark authors' own model beat the human figures first, and we say so on the page. It proves three things we needed to know before starting a company on them. A small model, 7 million parameters, fine-tuned on the public corrections, reaches the published state of the art on both proofreading tasks. Its error falls as a power law in training data with no sign of leveling off, so more corrections, which a factory generates every day, buy predictable gains. And the model trained on electron microscopy transfers to expanded light-microscopy tissue, so the decades of public electron-microscopy proofreading are training data for the new method.
What it does not prove is that a whole brain can be finished without people. The benchmark scores decisions that a proofreader already raised; finding the errors in a fresh volume is the harder half, and the number that matters is human hours per cubic millimeter, end to end, against the best automated pipeline, with the wrong joins counted per length of axon. Our own end-to-end pipeline, run once under a pre-registered protocol on nine held-out cubes of the public mouse cortex volume, none seen in training, closed about a fifth of the breaks and added a few wrong joins. We publish that number because the company's job is to move it, and because a reader who finds it later would trust nothing else on the page.
Nor does the plan need zero people. It needs the hours per cubic millimeter to fall a few hundred-fold from Wellcome's figure (the arithmetic is in the question on what $100 million has to buy), and the scaling exponents on the page, 0.20 and 0.16, say what each doubling of corrections buys. A factory generates corrections every day it runs; that is the data the law feeds on.
The nine-cube test is public in full: the pre-registration file with its hashes, the execution record, the per-neuron outputs and the scoring code are one download on our research page, so anyone can rescore it.
Sources: braininsights.ai/research, the pre-registered evaluation of October 2026.
A static map is anatomy. How does it tell a drug developer that receptor X produces effect Y?
It does not, by itself, and the page does not say it does. The map ranks hypotheses: for a receptor, it says which neurons carry it, where those neurons project, and which circuits can therefore be reached by a drug that binds it. For the GLP-1 receptor that is the difference between the neurons that reach the circuits for satiety and the ones that reach the circuits for nausea, which today's two best papers disagree about.
Conviction comes from the second half of the product. The customer doses animals and sends us the tissue; we image the treated and untreated circuits against the reference map and report the difference, synapse by synapse. Hypothesis from the map, test from the tissue. The genome worked the same way: the sequence did not say what a gene does, but every experiment afterward was designed against it.
The two GLP-1 papers that disagree did not fail for lack of a map; each used silencing and rescue experiments that are stronger than anatomy. What they lacked was a common reference: each group defined its neurons by its own markers and its own atlas registration, so the results cannot be laid on top of each other. A map at this resolution is the reference both would register to, which is the first thing it is for. Nor does a receptor map predict a pharmacological paradox on its own: a GIP receptor agonist and a GIP receptor antagonist both cause weight loss, and no anatomy would have called that. What the map frames is the dosed-tissue readout that shows whether the two reach the same circuits, which is the experiment that resolves it.
No G protein-coupled drug target has been imaged in expanded tissue at this resolution, and antibodies to receptors like GLP-1R are unreliable. How will you label them?
Correct on both counts, and it is listed on the page as among our first measurements. The tools are reporter mouse lines, in which the cells that express a receptor also express a fluorescent protein that is easy to image, and validated antibodies where they exist. The two answer different questions: a reporter marks which cells express the receptor, an antibody marks where the protein sits on them, and a study states which of the two it used. LICONN demonstrated a catalog of protein markers in its gels, cell-type and synaptic proteins imaged a few at a time alongside the structural stain, so the chemistry for adding a receptor label is established; what has to be shown is each receptor, one at a time. Expansion dilutes every label by the cube of the factor, about four thousand-fold at sixteen, and the same dilution applies to the background; LICONN's synaptic proteins are low-abundance and were imaged anyway. Whether a given receptor clears the bar is a measurement, which is why we do not promise any receptor on any schedule, only that each one is reported as measured.
Where neither works for a receptor, the fallback is cell type: spatial transcriptomics on adjacent tissue registers which cell types express the receptor, and the map says how those cell types are wired. That is coarser, and we say so when we sell it.
A related objection is that where a drug reaches matters as much as where its receptor sits; a peptide like semaglutide enters the brain mostly at a few sites with a leaky barrier. That is why the product measures dosed tissue rather than inferring from the map: the readout shows which circuits actually changed, distribution included, and the map says what those circuits are.
Pharma already has spatial transcriptomics, the Allen atlases, fiber photometry, chemogenetics and PET. What does a wiring diagram add?
Those tools answer where a receptor is expressed, which regions project to which, and what a population does when it is activated. None of them says which individual neurons that carry a receptor synapse onto which others, which is the level at which a drug's effects and its side effects separate. The Allen projectome is at the resolution of regions; MERFISH gives cell types without their synapses; photometry and chemogenetics read or drive a population you have already chosen. The map is what you choose it from.
The product is not a replacement for any of them. It is the reference that the others are registered to, and a comparison service, treated against untreated, that none of them can run at synaptic resolution.
A wiring diagram is not dynamics. The worm's has existed since 1986 and still does not predict its behavior.
True, and it is the right objection to a map sold as a simulator. We do not sell one. The worm's 302 neurons taught the field that the same wiring is reconfigured by neuromodulators into different working circuits, which is exactly why our product pairs the map with a measurement: the customer's dosed animals, imaged against the reference, so what is reported is the change the drug produced, not an inference from anatomy alone.
The map earns its place by making that measurement interpretable and cumulative. A difference seen in a circuit is attached to identified cell types and their synaptic partners, and every study adds to the same reference, so the second customer's study is read against the first's. Without the map each experiment is a one-off; with it, the field's experiments add up.
The worm is also the wrong size for the argument. Its 302 neurons were mapped before anyone could run experiments on the map as a model, and the field's 2026 result on artificial networks, described under Reading the map, is that understanding a complete network compounds: the bigger it is, the more every explanation is constrained by the ones around it, and automated scientists can run the experiments that constrain it. In the whole-fly-brain model built on the FlyWire connectome, the wiring does predict the published activation and silencing experiments, at 0.83 AUROC on all 259 and 0.67 on the 90 its authors did not use to build it, and it stops predicting them when blurred to regions. A map with a model on it is dynamics enough to test, and the tissue says how well.
Even with a complete map, a brain may be too tangled to understand. Neurons in cortex respond to many unrelated things.
That was the settled view of artificial neural networks until 2026, and it rested on evidence that turned out to be misread. The neuron that fired for cats and cars detected a V shape; the layer where no neuron could be read was the product of an architecture that learned badly; the mixing that remained was related things grouped because they were related. With better tools, an architecture that learns well and agents to run the experiments, about 90 percent of the neurons in a 32-billion-parameter language model have one job, and the author's conclusion is that a tangled-looking neuron is usually a statement about the observer, not the neuron. The section Reading the map lays this out with its numbers and its source.
The brain's version of the cat-and-car neuron is mixed selectivity: neurons in prefrontal cortex that respond to combinations of task variables, recorded through a few electrodes. The essay's author, who is not a neuroscientist and says so, writes that if the cat-and-car neuron were in a human brain seen through a few electrodes or a blood-oxygen signal he would discount the polysemantic reading almost to zero, because he could not see what that neuron was when it was in front of him for years with every tool he wanted. We do not know whether mixed selectivity dissolves the same way. A complete map with a model on it, where every neuron can be driven and silenced, is the instrument that can tell, and a few electrodes is not. Our own first measurement on the mouse, in October 2026: on the MICrONS cubic millimetre, with one snapshot of activity and no experiments to run, an agent reading each neuron's wiring predicted its tuning no better than its location did. Whether cortical wiring is unreadable or only unrunnable is what a model on the map would settle.
What a map does not supply is the experiments. Everything in that result depends on removing a neuron and rerunning the input, which a fixed brain cannot do. The experiments run on the model built from the map; the dosed tissue checks the model. That is the loop the product is built around, and it is why we are testing the method on the fly model first, where the loop already closes in software.
Sources: Cammarata, Neural Networks Are Already Clean, Goodfire, 2026.
A drug program cares about one circuit. Why map a whole brain instead of that circuit?
Because the circuit cannot be checked on its own. An explanation of what a population does is tested against what its inputs do, what its outputs do, and what happens when its neighbors are removed, and in an unmapped brain none of those is known. The field reading neural networks found the same thing: understanding one row of an otherwise empty crossword is possible, but without the crossings there is no way to know it is right, and the whole network turned out to be easier to understand than the parts alone. Each circuit explained constrains the next; a whole brain gives every crossing.
The measured version is in the fly. Blur the FlyWire wiring to the resolution a regional atlas gives, run the published whole-brain model, and it stops predicting the published experiments: 0.51 AUROC, chance, against 0.83 with the real wiring on 259 experiments. Activity still spreads; it no longer reaches the right neurons. A regional study for a customer is the first product because it fits a slab and a confocal that exists today, but every study is registered to the whole-brain reference, and the whole brain is what makes the second study cheaper than the first.
The interpretability essay you cite is about artificial networks, calls itself a working hypothesis, and disagrees with part of its own field. Why build on it?
We do not build on it. The brain gets mapped either way, and the first product, a drug developer's dosed tissue compared against the reference, does not depend on any claim about neural networks. What the essay supplies is a reason to think the reading step is tractable and a method for doing it: neuron papers, attribution graphs with the network's own neurons as nodes, explanations that a second agent can test blind, all run by agents at a scale no laboratory of people could match. We cite it as what it is, an informal essay by the researcher who co-wrote the papers it revises, with his own confidence stated at about 85 percent and the technical companion still to come, and we quote the counterexample he names himself.
The disagreement inside the field is about whether to read a network's own neurons or train a second model to decompose it first. For a brain that question is moot: the neurons are the only units there are, and nobody is proposing to decompose a brain into something else before reading it. Where the essay matters is the claim that reading the original units works, and gets easier as the map fills in. We are testing that claim on the fly model under a pre-registered protocol, and the result goes on this page either way.
Sources: Cammarata, Neural Networks Are Already Clean, Goodfire, 2026.
Most brain drugs act on G protein-coupled receptors, which signal largely outside synapses. Why would a synaptic map matter for them?
Because the neurons still matter even where the signal is diffuse. A receptor on a cell changes that cell's output, and the cell's output goes down its axon to its synaptic partners; volume transmission changes who is listening, not where the listeners' wires go. The map says which neurons carry the receptor and where their output lands, which is the question a developer asks when a drug's main effect and its side effect come from different circuits.
The expansion chemistry also images proteins directly, so the receptor's position on the cell, on the soma, the dendrite, or at a synapse, is part of the readout. That is information no transcriptomic atlas has, because messenger RNA does not say where the protein went.
CROs already sell whole-brain activity screens: dose the animal, clear the brain, image c-Fos. Isn't that your regional study at today's prices?
It is the baseline we have to beat, and we say so to customers. A c-Fos screen counts the cells that responded, at cellular resolution, and reports them by region registered to the Allen atlas. What it cannot say is what those cells connect to, which cell types they are at synaptic resolution, or whether the cells that responded are the ones that carry the receptor. A regional study answers those three questions on the same tissue, and the first pilots are designed to show, on a compound the customer already has c-Fos data for, what the extra resolution changes.
If it changes nothing for a given question, the customer should keep buying the screen. The business is built on the questions where it does.
It is a mouse. Neurology programs fail in humans.
They do, mostly in Phase 2 and 3, and no mouse map changes a human efficacy readout. What it changes is the choice of what to put into those trials: which receptor, in which cell type, and which liabilities the circuit predicts. Those choices are made largely in rodents today, by every company, with far less information than a map provides.
The receptors most brain drugs bind are conserved between mouse and human, which is why mice are the pharmacology model in the first place; the circuits are conserved less perfectly, and a study says which of its findings rest on which. A human map at this resolution is the long-term vision, and a human cortex sample has already been reconstructed this way with electron microscopes.
The Recursion and Cerevance deals bought human-tissue platforms with programs attached. Are they fair comparables?
They are precedents for one thing: that pharma pays upfront for a map of biology it cannot make itself and pays again on milestones. Each bought something different, Recursion a phenomic screening platform, Cerevance human brain cell-type expression data, and neither is what we sell. They set the shape of a platform deal, not its price. Our first revenue is regional studies, sold one at a time at a fee a pharmacology budget already carries, and platform deals come only after studies have changed decisions.
How much data is a brain at this resolution, and is compute in the budget?
At LICONN's voxel size, 10 by 10 by 25 nanometers, a mouse brain is about 200 petavoxels per channel: 200 petabytes at one byte per voxel, a couple of exabytes with the structural channel, the synapse markers and the receptor channel all stored at sixteen bits, before compression. MICrONS was about 1.6 petabytes for one cubic millimeter, the figure usually cited for it, so this is more than a hundred times the largest map ever handled, and segmenting it is a compute line of its own, of the order of tens of millions of dollars at cloud prices. It is in the budget, and it is small next to the proofreading line it replaces, which Wellcome puts at $7 to 21 billion. The software to run it at that scale, the flood-filling networks, the alignment and the storage format, is open source from Google's group, and running it on a cloud rather than Google's own machines is a cost, not a research problem.
Show the bottom-up arithmetic. What does $100 million have to buy, and what does that imply for proofreading?
Our arithmetic, from the figures on this page, each a target until measured. Imaging: at LICONN's confocal rate the brain is about 400 instrument-years, so a hundred instruments for four years at a few hundred thousand dollars each, $20 to 50 million with operation; a light sheet that holds the resolution brings that to a handful of instruments and a fraction of the sum. Storage and compute: about 200 petavoxels per channel to hold and segment, tens of millions of dollars at cloud prices. Tissue, animals and labels: small next to those. That leaves of the order of $20 to 50 million for human correction.
At Wellcome's $20,000 per person-year that is 1,000 to 2,500 person-years of proofreading for the whole brain, against the 0.3 to 1 million in Wellcome's estimate: a reduction of a few hundred-fold in human hours per cubic millimeter, not a hundred and not zero. Today's measured starting points are PATHFINDER's automated repair on electron microscopy, our pipeline's fifth of the breaks on held-out tissue, and the benchmark scaling law. The measurement that the first two years exist to make, and that the 2028 report states as a number, is human hours per cubic millimeter on our own expanded tissue, with the wrong joins counted per length of axon. If it does not extrapolate to those 1,000 to 2,500 person-years, the whole brain does not cost $100 million, and we say so.
What does 'mapped' mean? A draft segmentation or a proofread map?
A dense reconstruction of every neuron in the brain with its synapses detected and the cell types and the labeled receptors attached, at a published error rate per length of axon, with the regions customers have paid to study proofread to the standard used for analysis today. A whole brain proofread by hand to that standard everywhere is what costs billions, and nobody has it; a whole brain at a known error rate, with the models improving it every month, is what we deliver, and the error rate is part of the product, not a footnote to it.
The methods are published and the strongest groups have a head start. What is the moat, and why not just join E11 Bio?
The methods are open, by their authors' choice: LICONN and PATHFINDER are both published CC BY, and we will use them, credit them, and publish our own. E11 Bio's PRISM reagents are shared for non-commercial use, and LICONN's authors disclose a patent application, so the plan carries licenses for both where they are needed; if barcodes prove necessary and a license is not available, we build our own. That is a line in the plan, not a surprise. The moat is not a method. It is the factory, the brains it accumulates, which make every later map cheaper and every comparison more valuable, the corrections it logs, which train models nobody else has the data for, and the customers whose dosed tissue only we have imaged. That is the moat sequencing companies had: the chemistry was published, the instrument and the installed base were the business.
E11 Bio is a nonprofit that publishes its methods toward a mouse brain on philanthropic funding, and we would rather collaborate than compete; our transfer result was measured on their public data. What a nonprofit does not build is a factory with customers, and what no research group has is a reason to run the same brain a thousand times. That is the company.
At $200,000 per cubic millimeter, twenty animals is $4 million. How can a regional study be affordable in 2027?
Because a regional study does not image a cubic millimeter per animal. It images the circuit the question is about, a region of a fraction of a cubic millimeter chosen in advance, in a slab, with the receptor and an activity marker labeled, and compares the treated animals against the untreated ones and against the reference. The volume, the number of animals per arm, powered and blinded rather than one animal a side, and the sampling plan are part of the study design and are stated in the quote, with the error rates for the region.
The $200,000 figure is the whole-brain production cost we are building toward for 2033; it is not the 2027 study price, which is set by what the study costs us then and what the decision is worth to the customer. The first studies are priced as a research budget line, with the fee rising only once a study has changed a program decision.
Where does Wellcome's $7.5 to 21.7 billion come from? Its text says 100,000 person-years, which at $20,000 is $2 billion.
The report gives the lines in its text: proofreading $7 to 21 billion, registration and segmentation $300 to 400 million, imaging $200 to 300 million, total $7.5 to 21.7 billion, all for a single mouse brain with current technology and excluding the cost of developing anything new. Those dollar figures are what this page cites. The person-year count behind the proofreading line sits in the report's cost box (its Figure 5), which derives it from the fly connectome's measured rate at $20,000 a person-year, giving 0.3 to 1 million person-years; the report's narrative elsewhere rounds the labor to about 100,000 person-years. The two are reconciled by the wage: $7 to 21 billion is 0.3 to 1 million person-years at $20,000, or 100,000 person-years at $70,000 to $210,000, which is what a fully loaded technician costs in the United States. Our own check against the published hemibrain rate puts a dense mouse brain nearer 2 million person-years at the fly's standard of completeness, so the figure is, if anything, low.
That is also why the comparison to today's cost is not inflated by labor: labor is the cost, under either count. The company exists to replace that line.
The GLP-1 drugs became a $70 billion category without a brain map. Why would pharma need one now?
They did, and the same decade produced the reason to want one: nausea that limits the dose, discontinuation rates that are the main thing the next generation competes on, and a pipeline of dual and triple agonists whose receptor combinations are being chosen by trial, two years and hundreds of millions of dollars at a time. The first drug in a class is found without a map; the second, third and tenth are the ones a map makes cheaper to choose, and that is where the money in the class now is.
The claim is not that drugs cannot be made without a map. Genomes were not needed for aspirin. The claim is that once the map exists and is cheap, every program is designed against it, because the ones that are not will lose to the ones that are.
How much money does the plan need, and what does an investor own if the brain is late?
The seed round is $10 million and it buys one measurement in public: the cost of correcting the tracing on expanded tissue at our resolution, on a pilot imaging line, with the result published whether it passes or not. The whole plan needs $300 to 500 million over about five years, raised in stages, each released by the one before it, with the largest rounds released only when the measured cost says a whole brain is affordable. Nobody is asked for the whole sum on day one.
What the money builds along the way is a business that does not wait for the brain: the regional studies sold from 2027, the receptor labels validated one by one, the imaging line and the models, and the reference volumes that accumulate under them. If the whole brain is late, that company exists; if the measured cost never extrapolates to under $100 million, we say so, and the company is a smaller one than we set out to build. We would rather state that than pretend the plan has no gate.
Every animal is wired differently. How do you compare a dosed animal to one reference map?
Not neuron by neuron. No two mice share a neuron, so the units of comparison are the cell type and the circuit: how many synapses of each type a labeled population makes onto each partner population, and how that changes with the drug. That is what the reference carries, and it is what a study reports. The between-animal variation is measured inside every study from the untreated animals, which is the control the comparison is made against, and the fact that it has never been measured at this resolution is one of the things a customer is paying to learn.
Each study's animals also join the reference. The one brain of 2033 is the first of a series, and the comparisons get sharper as the series grows, because the variation is then known rather than assumed.
The platform business needs a brain for under $1 million. That is another hundred-fold after the first hundred.
Yes, and it is the same mechanism a second time, on the two precedents on this page. The first brain carries the instrument development and the mistakes; the second runs on instruments that exist, models trained on the first brain's corrections, and a staff who have done it once. Sequencing fell a million-fold not in one step but in a series of them, each paid for by the customers of the step before. The $1 million brain is not promised for a date. It is the point at which whole-brain comparisons become a product, and the page says what becomes affordable at each price along the way.
Sixteen-fold expansion of a whole brain is two liters of gel. Can expansion, staining and labeling be uniform across hundreds of slabs?
There is never a two-liter gel. Each slab is expanded on its own, as LICONN's were, so the object handled is a slab one to five millimeters thick and ten to sixteen centimeters across at full width, or smaller pieces at the price of more boundaries, and the question is uniformity between slabs rather than within one enormous one. LICONN measured its expansion factor at 15.4 with a standard deviation of 1.7 across replicates from three mice, and distortion within a slab is measured against a coarse image taken before expansion and corrected in registration, which is how expansion microscopy has been quantified since it was introduced.
Across hundreds of slabs the chemistry has to be a production process with a quality score per slab: expansion factor, stain penetration, label signal, and the fraction of the slab that traces cleanly. A slab that fails its score is a hole in the map that cannot be re-cut, so the process is validated on many slabs from many animals before the first production brain is sectioned. Nobody has run expansion at that scale; it is a factory discipline, and it is the wet-lab work of the first two years.
Your exponents, 0.20 and 0.16, mean halving the error takes 30 to 75 times the data. How is that a plan?
On its own it is not, and the page does not claim the curve alone finishes a brain. It says what more data buys, and the point of a factory is that data of this kind is its by-product: every region a customer pays to have proofread produces corrections, about a million on MICrONS's single cubic millimeter, and a brain is five hundred of those. The curve is the floor, not the plan.
The plan is the levers that move the curve rather than ride it: structured repair of the kind PATHFINDER showed, which took the expected error-free run length of an axon from 82 to 94 percent without a larger model; the constraints that a whole brain adds and a cube lacks, since a long axon has to go somewhere and a slab boundary has to match; protein barcodes if they prove to help; and the fact that the plan needs the human hours per cubic millimeter to fall a few hundred-fold, not to zero. Which of those levers does what is measured in public as we go.
Why hasn't Google, the Allen Institute or E11 Bio done this already?
They built the pieces, and none of them is funded to assemble a whole brain. Google's connectomics group is a research team that publishes methods and co-authored LICONN. The Allen Institute's whole-brain work is funded through NIH's BRAIN CONNECTS program for about 10 cubic millimeters by 2028, as is Harvard's, and the Harvard grant was terminated and restored within one year. E11 Bio is a nonprofit that publishes its methods and is working toward a mouse brain on philanthropic funding. Meridial, a nonprofit research organisation set up in London in 2026 with funding from ARIA, plans synapse-resolution mapping of circuits for CNS drug development, the closest statement of our first product by another group; it has published no results yet. We would rather the field were crowded than empty: every group that gets the method working makes the map cheaper, and the company is the one organised to sell what the map says.
A whole brain at this resolution needs a factory: dozens of instruments, an animal facility, a reconstruction pipeline run as production, and a customer who pays for the output. That is a company, and this is it. We will use every published method, credit it, and publish our own measurements, including the ones that fail.
2033 is a long way off. What happens in between, and how would an investor know if it is not working?
The plan is staged against measurements, each one reported whether it is good or bad. In the first two years: the imaging rate and resolution of the light sheet we build, the error rate across slab boundaries, the first receptor imaged in expanded tissue, and the fraction of corrections our models make on tissue they have never seen. By the end of 2028 we will know whether the measured cost of correcting the tracing extrapolates to a whole brain for under $100 million, and we will say so either way.
Revenue starts before the whole brain: from 2027, regional studies of one circuit for one compound, which need a slab, not a brain, and a spinning-disk confocal of the kind LICONN used, which exists today, not the light sheet, which is for the whole brain. The whole brain is the product that makes every study after it cheaper.
The third market, extending life indefinitely, reads like science fiction.
It is the long-term vision and it is labeled as one: the page says the odds are low and the journey long. The company does not depend on it. The first two markets, pharma's decisions and the drugs designed against a map, pay for the factory on their own, and both exist today. We state the third because it is why the founder is doing this, and because a map good enough to predict what a drug does is the first step toward a model of the brain that runs on its own, whether or not that step is ever taken.
A pharma customer sometimes reads it as a sign that their business is a bridge to something else. It is the opposite: the pharmacology product is the only way the maps get made, and every map a customer pays for is a better reference for the next customer. Pharma is the business; the vision is what the business makes possible.